All the statistics formulas I have discussed so far are true, and are perfectly safe to use in the experiment. However, we always test just a sample of a population, as it is simply impossible to test the entire population. Is it possible then to say that our experiment results are true for the population if we only tested its little part?..
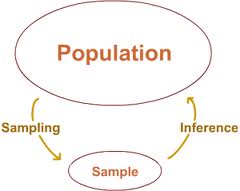
YES, it is possible - but only if this generalisation (or, inference) is done right. In this post I will talk about Inferential Statistics; it provides some essential rules which make it possible to draw conclusions about the population from the sample scores.
YES, it is possible - but only if this generalisation (or, inference) is done right. In this post I will talk about Inferential Statistics; it provides some essential rules which make it possible to draw conclusions about the population from the sample scores.