
what do I do with this??..
Today I will look into the Non-Parametric tests. I will start with a quick recap on what Non-Parametric tests actually are and when it is appropriate to use them. I will also remind how to rank data to make it ordinal and how to deal with tied scores.
This particular post will focus on the test for related samples (same participants tested in different conditions): its assumptions, calculation and significance testing.
This particular post will focus on the test for related samples (same participants tested in different conditions): its assumptions, calculation and significance testing.
When to use Non-Parametric Tests
In general, it is preferable to use Parametric Tests whenever possible (see 'Advantages and Disadvantages' section below). However, sometimes the assumptions for Parametric tests are violated, and we have to use Non-Parametric tests instead:
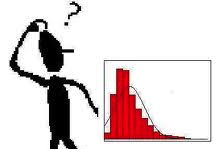
1. Distributions are seriously NOT normal; skewed. Overall, no data distribution requirements need to be satisfied in order to perform a Non-Parametric test (thats why they are also called distribution-free tests sometimes).
2. Non-homogenous variance (in case of between-subjects design)
3. Data is ordinal or categorical instead of ratio/interval: cases are ranked in order (1, 2 etc).
Advantages and Disadvantages
Advantages of Non-Parametric Tests
1. The computations are much easier.
2. Very few requirements - so it is unlikely that they will be used inappropriately.
3. Can be used for ordinal and categorical data.
Disadvantages of Non-Parametric Tests
1. The results of these tests are less powerful. It means that there is much more probability to make a Type II Error (accepting the Null Hypothesis when it is in fact false).
2. The procedures are less effective than those of Parametric Tests. It means that a much larger sample is needed to have the same probability of the Type I Error (falsely accepting the Alternative Hypothesis) as the equivalent Parametric test.
As you can see, although Non-Parametric tests are easier to conduct, they are much less reliable than Parametric Tests, so it is always advised to use Parametric ones whenever it is possible. Each Parametric Test has a Non-Parametric equivalent; non-parametric equivalent of t-test for related subjects is Wilcoxon Matched Pairs Test.
Ranking your Data
Non-Parametric tests work with ranks of data rather then data itself. So let's see how to transform scores into ranks.
The basic process is really simple: you arrange your scores in ascending order and then rank them: 1, 2 and so on.
So, for example, for the scores set of 10, 5, 2, 8 we need to arrange them in 2, 5, 8, 10 and assign ranks to them: 2 will have rank 1; 5 is 2; 8 is 3; 10 is 4.
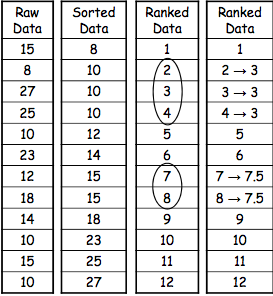
However, sometimes we have to deal with tied ranks. This happens when our data has several identical scores. For example, we might have arranged our scores and found that our set is as follows: 1, 4, 6, 6, 6, 8, 10, 10, 24. How do we rank these identical scores?
We simply calculate a rank mean and assign it to each of the repeated scores. The following table will make it clear:
The basic process is really simple: you arrange your scores in ascending order and then rank them: 1, 2 and so on.
So, for example, for the scores set of 10, 5, 2, 8 we need to arrange them in 2, 5, 8, 10 and assign ranks to them: 2 will have rank 1; 5 is 2; 8 is 3; 10 is 4.
However, sometimes we have to deal with tied ranks. This happens when our data has several identical scores. For example, we might have arranged our scores and found that our set is as follows: 1, 4, 6, 6, 6, 8, 10, 10, 24. How do we rank these identical scores?
We simply calculate a rank mean and assign it to each of the repeated scores. The following table will make it clear:
Non-Parametric Test for Related subjects:
Wilcoxon Matched Pairs Test
It is easy to remember that Wilcoxon test is used for related samples: just think of the letter W in 'Wilcoxon' as a hint to Within-subjects design.
The calculation is very easy, however it involves many steps and may be confusing. I will show it in the example.
EXAMPLE and CALCULATION
Is depression level straight after alcohol consumption different for alcohol consumers than the day after the consumption? The level of depression is measured in the same participants twice: after the alcohol consumption and the next day.
Null Hypothesis: There is no difference in depression level between the two points in time.
Alternative Hypothesis (two-tailed): there will be significant difference between the depression levels in the two points in time.
Independent Variable: alcohol consumption
Dependent Variable: depression level
So, imagine the following data:
Participant | Depression Level 1 | Depression level 2 |
This test is looking at the difference between the pairs of scores, therefore we do not rank the actual scores; we need to calculate the differences between them first (taking the sign into account!) - and then rank those differences (NOT taking sign into account). In case when the difference is equal 0 we simply disregard it (as it is the case with our 7th participant) - and then, add the sign back. So, we will have the following tables:
Depression 1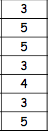 | Depression 2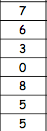 | Difference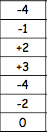 | Rank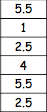 | -/+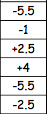 |
Next steps are:
1. Sum the positive ranks (2.5+4 = 6.5)
2. Sum the negative ranks (5.5+1+5.5+2.5 = 14.5)
3. The smaller figure is out T-value (6.5)
1. Sum the positive ranks (2.5+4 = 6.5)
2. Sum the negative ranks (5.5+1+5.5+2.5 = 14.5)
3. The smaller figure is out T-value (6.5)
Significance Testing
1. Find the T value (ours is 6.5)
2. Determine N (number of score pairs; ours is 6, as we do not take into account pairs with zero difference)
3. Set he significance level (typically, p<0.05)
4. Consult the significance table for the critical range and see whether our T value is within this range.
2. Determine N (number of score pairs; ours is 6, as we do not take into account pairs with zero difference)
3. Set he significance level (typically, p<0.05)
4. Consult the significance table for the critical range and see whether our T value is within this range.
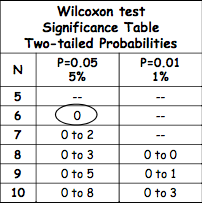
As you can see, our T value of 6.5 is not within the critical range, therefore we accept the Null Hypothesis: we found no significant difference between the two conditions.
