
In descriptive statistics, there are three concepts which help us describe our data: central tendency (how typical it is), dispersion (how varied it is) and distribution (how data is distributed). In this post I will talk about the central tendency, in other words, determining the AVERAGE of your data. I will discuss three main concepts here: mean, median and mode. I will also discuss the mild and extreme outliers and explain the tricky procedure of identifying them. They actually describe dispersion of data, but because finding them involves some operations with the mean, I decided to show it in this post.
Mean
Mean is the most simple concept when it comes to determining the average in statistics. We use it on the day-to-day basis. To calculate it, simply divide the sum of all the scores by their number. So:
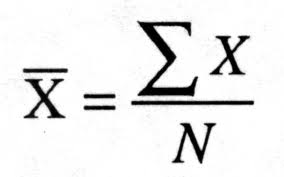
X with a dash is sample MEAN; E (sigma sign) is a SUM; x is the SCORE; N is the NUMBER of scores.
Ex means sum of the scores X, thus Ex = X1+X2+X3...+Xn.
Ex means sum of the scores X, thus Ex = X1+X2+X3...+Xn.
Median
The median is the middle of a set of scores when they are organised from the smallest to the largest.
For example, let's say we have a set of following scores: 8, 20, 1, 3, 1, 12, 5, 1, 6. If we put them in order we get 1, 1, 1, 3, 5, 6, 8, 12, 20. Thus, the median is the fifth score (since there are 9 of them), which is 5.
When there is an odd number of scores, we would normally calculate the average of the two middle scores. Say, if there was another score in the set above - for example 2, - the median would be an average of the 5th and 6th scores, which equal 3 and 5. So, the median equals 4 for the set of
1, 1, 1, 2, 3, 5, 6, 8, 12, 20.
If there was a score of 13 in that set (instead of 2), the median would still equal the average between the 5th and 6th scores, but in this case they would be 5 and 6. Thus, the median equals 5.5 for the set of 1, 1, 1, 3, 5, 6, 8, 12, 13, 20.
Mode
The mode is the most frequently occurring category of data. This is the only average which can be applied to nominal data as well as to scores.
In the example above, the frequency (f) of the score 1 equals 3 (since it occurs three times in the set), which means that 1 is the mode of the set of 1, 1, 1, 3, 5, 6, 8, 12, 20
Sometimes there can be more than 1 mode, and in this case it is called Bi-modal distribution.
In the example above, the frequency (f) of the score 1 equals 3 (since it occurs three times in the set), which means that 1 is the mode of the set of 1, 1, 1, 3, 5, 6, 8, 12, 20
Sometimes there can be more than 1 mode, and in this case it is called Bi-modal distribution.
Outliers

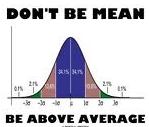
As you can see from the picture, the outliers are the scores which are obviously Atypical. A single outlier can completely change the average, thus putting the analysis at big risk of errors. Therefore, it is important to identify them and take into account.
To do so, you need to calculate the interquartile range, which is the range of scores unaffected by outliers. To do so, arrange the scores from the smallest to the largest one and simply ignore 25% of the lowest and 25% of the highest scores. Since the outliers are unusually high or low scores, they will not affect the remaining 50%. Interquartile range equals the difference between the highest and the lowest score of these 50%.
Lets imagine that we have a set of numbers: 124, 118, 115, 65, 122, 120. Let us put them in order: 65, 115, 118, 120, 122, 124. Deleting the extreme quarters leaves us with 118, 120. Now, the interquartile range is 120 - 118 = 2.
Then, to identify outliers, we multiply the interquartile range by 1.5, which in our case equals 2*1.5 = 3. The outliers among the low scores are the scores which are smaller than the smallest score of the interquartile range minus this number; in our example,
118 - 3 = 115. Any score smaller than 115 is an outlier, so in our set 65 is an outlier.
The outliers among the high scores are the scores which are bigger than a sum of the biggest score of the interquartile range and this number; in our example, 120 + 3 = 123. Thus, 124 is an outlier.
This formula, however, identifies mild outliers. To find extreme outliers, multiply the interquartile range by 3 rather than 1.5. In our case it will be 2*3 = 6. Then the procedure is the same: lowest score of the interquartile range minus this number equals 118 - 6 = 112; biggest score of the interquartile range plus this number equals 120 + 6 = 126. Thus, the score of 65 is an extreme outlier (since it is smaller than 112), while 124 is only a mild outlier (since it is NOT bigger than 126).
