

I have covered parametric test for within-subject design. In this post, I will talk about the parametric test for between-subject design: Student's t-test for unrelated samples. Instead of looking at the differences between the pairs of scores (as t-test for related samples does), it looks at the differences between overall means of the two samples.
I will cover the assumptions for this test, explain the calculation process and significance testing, and finally talk about the Levene's test, which is only implemented in t-test for unrelated samples.
I will cover the assumptions for this test, explain the calculation process and significance testing, and finally talk about the Levene's test, which is only implemented in t-test for unrelated samples.
Assumptions
So when do we use the t-test for UNrelated samples? In other words, what are the assumptions?
1. Measurement: data are measured at the numerical or interval level.
2. Independence: the participants' scores in each of the samples are independent from each other. The scores are independent from each other within the samples too.
3. Normality: data within each sample is normally distributed.
4. Homogeneous Variance: Standard Deviations of the two samples are equal.
This is an important assumption. In the between-subjects design, we test different participants, therefore we have to make sure that their individual differences are accounted for. In other words, we want to make sure that we only measure the difference caused by the experimental manipulation. Therefore, the variance of the two groups should be approximately equal or homogeneous. The general rule is that the larger variance should not be more than 3 times larger than the smaller variance. When using statistics software such as SPSS, Levene's test accounts for it; I will discuss it further down in the post.
Calculation
The calculation, once again, is a notorious process but does not involve any new math. The formula looks actually quite scary, but once you break it down it is not that bad. So, basically it is as follows:
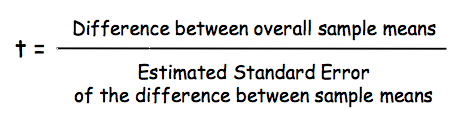 | 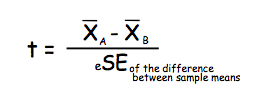 |
'A' refers to Sample 1 and 'B' - to sample 2.
To calculate the sample means, sum the scores of each sample up and divide by their number.
To find the difference between these means, simply subtract one from another.
Estimated Standard Error of the difference between sample means... here is where it gets a bit messy... The defining formula is:
To calculate the sample means, sum the scores of each sample up and divide by their number.
To find the difference between these means, simply subtract one from another.
Estimated Standard Error of the difference between sample means... here is where it gets a bit messy... The defining formula is:

And to actually calculate it, here is the computational formula:
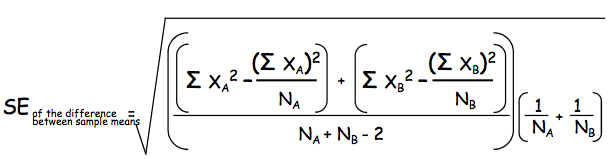
After this beast is calculated, divide the difference between the sample means by it - this is your t-value!
Levene's Test for Equality of Variances
There is no by-hand calculation for the Levene's test; stats software normally would deal with it. What you should know, however, that the value of the Levene's test should be NON-significant (p>0.05). If it is significant (p<0.05), it means that the assumption of equal variances is broken, and this test can not be performed. In this case, you will have to use Non-Parametric test (see following posts).
Degrees of Freedom and Significance Testing
To quickly recap: Degrees of Freedom (DF) show how many scores can vary without changing the sample mean. For the UNrelated samples test, Degrees of Freedom = N1 + N2 - 2 (where N1 is number of scores in the sample 1, and N2 - number of scores in sample 2).
Apart from the difference in finding the Degrees of Freedom, the process of Significance Testing for Parametric tests for unrelated subjects is exactly the same as for Parametric test for related subjects. To test your results for the significance, you need to calculate the t-value and degrees of freedom and set the significance level (normally p<0.05). Basing on the p and DF, use the significance table to find the critical value; then compare your t-value with the critical value.
If +t > + critical value or -t < - critical value, we can accept the H1. It means that there is a statistically significant difference between the means of the two samples, and that this difference falls in the 5% of the extreme cases.
