
In this post, I will introduce you to t-scores and explain how they are similar to z-scores (remember those? They tell us how likely it is for a particular score to occur). I will also talk about t-distribution and its assumptions and explain the role which t-scores play in Hypothesis Testing; actual calculations and t-tests, however, will be discussed in the next posts.
z-scores v t-scores
In order to comprehend the logic behind t-scores, you should remember two things from the previous posts: the concepts of z-scores and Standard Error.
* We transform scores into z-scores in order to get a z-distribution. It tells us how likely it is for a particular score to occur; Standard Deviation indicates how much a particular score differs from the scores mean.
* Standard Error is a Standard Deviation of Sample Mean from a Population Mean. In other words, it is a measurement unit of how much the mean of our sample differs from a population mean.
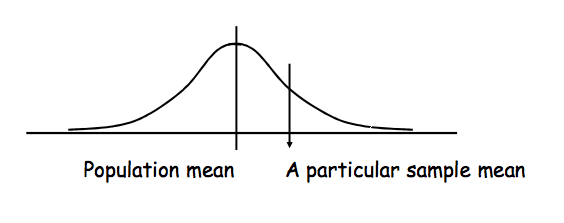
We use z-scores to see the difference between a score and the mean using Standard Deviation as a measurement unit; we use t-scores to see the difference between the sample mean and population mean, using Standard Error as a measurement unit.
Therefore, t-score is a number of Standard Errors by which the observed sample mean differs from the population. T-distribution tells us how likely our sample mean is to be a population mean.
* We transform scores into z-scores in order to get a z-distribution. It tells us how likely it is for a particular score to occur; Standard Deviation indicates how much a particular score differs from the scores mean.
* Standard Error is a Standard Deviation of Sample Mean from a Population Mean. In other words, it is a measurement unit of how much the mean of our sample differs from a population mean.
We use z-scores to see the difference between a score and the mean using Standard Deviation as a measurement unit; we use t-scores to see the difference between the sample mean and population mean, using Standard Error as a measurement unit.
Therefore, t-score is a number of Standard Errors by which the observed sample mean differs from the population. T-distribution tells us how likely our sample mean is to be a population mean.
t-distribution
The shape of t-distribution is a normal curve - however, it changes slightly when the sample size changes. When the sample size is large, it is similar to z-distribution; with smaller samples, it becomes more flat. We need to know a sample size in order to calculate the Degrees of Freedom (I will explain how to calculate those in the next two posts). Degrees of Freedom basically tell us how many data points can be changed without effecting the overall result. Imagine, for example, that there are three scores: 3, 6 and 7, which give the sum of 16. Two of these are free to change their value, but the third one will need to be of a particular value in order to produce the same result. So, the first two could be changed randomly to 8 and 9, and then the third value will have to be -1. As it is easy to see, degrees of freedom for a single group is always n-1 (in which n is the number of scores). However, this is not always the case in the t-distribution, and I will explain why in the next post.
Application of t-scores: hypothesis testing
So what is the use of these t-scores?
In psychology statistics, we use t-scores to compare two means of two different samples in order to test a hypothesis.
Hypothesis testing is an inferential statistics procedure which evaluate the credibility of a hypothesis for a population basing on the sample data. There are two hypotheses involved in any experiment: Null Hypothesis and Alternative (Experimental) Hypothesis.
Null Hypothesis states that there is no systematic difference between the means of two samples - that is, the samples come from the same population with the same characteristics.
Alternative Hypothesis states that there is a significant difference between the means of our two samples - and therefore, these samples come from two populations with differences in their characteristics.
If the difference between the means falls in the 95% of the cases, we accept the Null Hypothesis; it means that the difference is not significant enough for us to be sure it did not occur by chance. However, if the difference between the means fall in the 5% of the extreme cases, we may reject the Null Hypothesis and accept the Alternative Hypothesis instead. This would mean that there is a difference between the means, and the samples do indeed come from different populations.
t-scores allow us to determine whether the difference is sufficient enough to fall into those 5% of the extreme cases. I will show how to calculate a t-score in the next post.
